Infographic research, copy and design in Brighton

I could have included promotion in the heading but it seemed like overkill! Hopefully you have got the picture: when it comes to visual content I have it down to a fine art.
Infographics are a highly visual way to present an idea, data or to tell a story. They are also very widely shared so offer your business a great way to reach a larger audience.
Infographics are easy on the eye but a lot of hard work goes into their apparent nonchalance.
- Find a theme that will resonate…
- Research the data…
- Bring it all together with creative copy…
- Bring it to life through stimulating design…
- And finally bring it to your audience through content marketing.
If the benefits of infographics sound attractive, but the process seems daunting, then maybe we should talk.
I am a Brighton-based content marketer who has been producing infographics for clients, and ensuring they reach as wide an audience as possible, for many years now.
And I can do it for you: check out my client testimonials.
You’ll notice that as well as researching, writing and creating infographics I can provide a lot more besides.
What’s more friendly advice and insightful comments are free with every enquiry.
Tell your story with an infographic
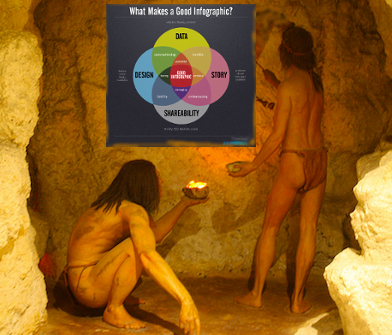
Infographics have been used to tell stories since cavemen poked a stick into the mud and started to draw on the rugged stone walls.
It’s just a bit more polished nowadays.
Today graphic design, detailed research and compelling narratives can combine to make the complex simple, the abstract visual and your business at the heart of it all.
Infographics are there to let you tell your story.
And, what’s more, people love them.
Who doesn’t love something that makes it all so easy to understand?
And when we love something we tend to share it.
And then it gets shared again.
And again…
Quite simply infographics help more people to hear about you, get more people to respect you and more sites to link to you.
That is a very happy ending indeed to your story.
“Data without some sort of analysis is just noise.
If it’s raining outside right now, we know it’s raining, but that’s it.
However, knowing what the weather was the entire week,
we can probably make some conclusion about the season we’re in
and what kind of weather we’re expecting.”
Irene Ros
Data-based or funny-faced?
And it doesn’t have to be all serious stuff.
Brands like international content specialists Upstream may need data compiling and presenting on the current state of internet usage in Europe, but other brands like Easy Wellies may just want something that’s a bit fun, such as this “If your festival were a welly” infographic.
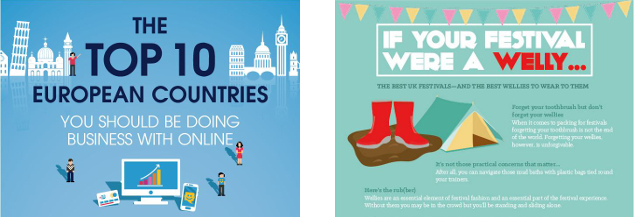
View Upstream’s data-based infographic 💡 View Easy Wellies’ funny faced infographic 😀
Both of these are infographics I have helped produce, and you can check out some of my other work and testimonials here.
Whether you want to educate, titillate, stimulate or agitate, it’s your story so you can tell it just how you want to.
“Readers and viewers love infographics”
Jeff Bullas
Creating infographics
I’m not a designer, but I work closely with several excellent ones. I am a writer and I am a researcher. Two out of three isn’t bad.
Oh, and I almost forgot, I’ve been promoting content online longer than I care to remember too.
- If you have some data you need making into a story and presenting visually: I can arrange that for you.
- If you just know you want some infographic content for your site: let me help make it happen.
- If you have a designer, but no content ideas: let me shape some for you.
- If you have just created a talented infographic don’t hide it under a bushel: let me shout about it from the virtual rooftops for you.
Infographics attract shares, build links and give your site that wow factor.
Fancy posting some?
“All the possibilities that infographic design offers can be used in every kind of site or publication. It’s just a matter of having the right topic at the right time.”
Luíz Iria